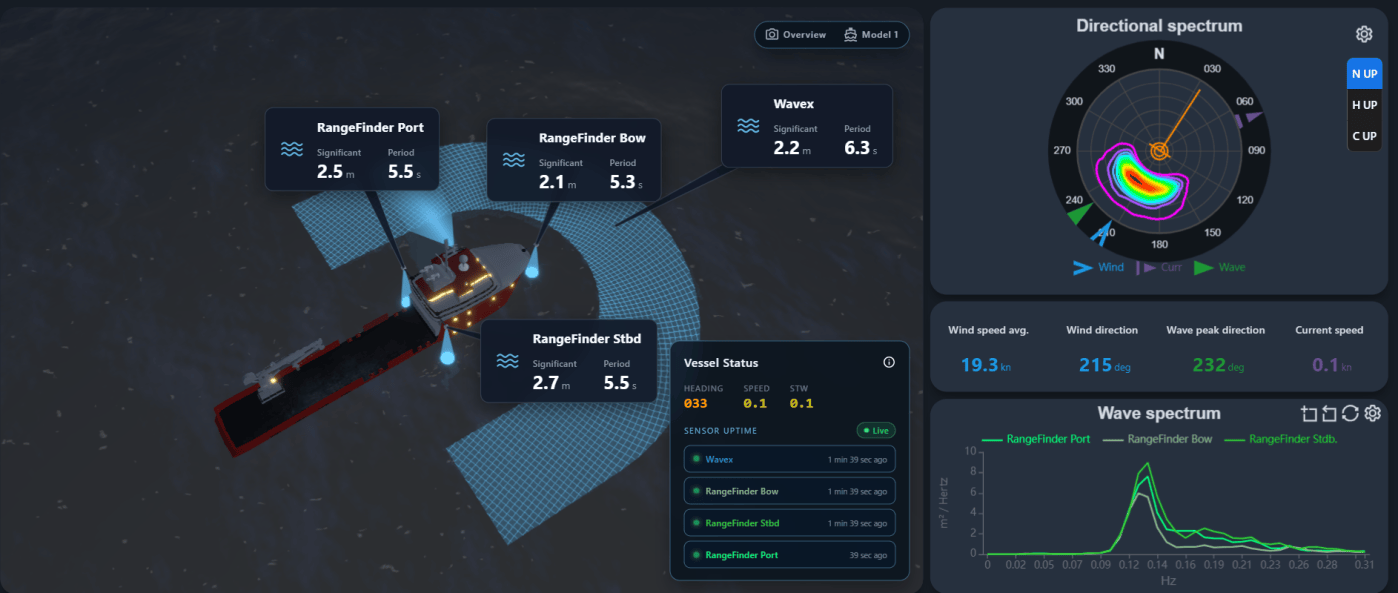
Oct. 22 – Miros, the Norwegian specialist in radar-based real-time ocean surface measurement, has introduced a 3D vessel view providing crews and operators with a consolidated view of the accurately measured sea state surrounding their vessel.
The new 3D interface in WaveSystem, a wave monitoring system for weather-critical offshore vessel operations, shows where each wave measurement is taken. It brings each installed measurement source, its measurement area and the key wave values together in one intuitive display, providing a bird’s-eye view of the sea state data most relevant to safeguard operations.
The feature is included for WaveSystem subscribers worldwide at no additional cost.
Wave conditions can differ around a vessel due to wave direction, vessel heading, hull geometry, shielding, and measurement location. Where multiple measurement sources are installed, comparing readings can help teams clearly understand differences between measurement areas and sea conditions affecting specific working areas.
“A wave reading is more useful when the crew can see where it comes from and how it relates to the work,” said Aurelia Paraschiv, Product Manager at Miros. “The 3D vessel view brings that context into one display, helping teams compare measured conditions around the vessel and understand which readings matter to their operation.”
Bridge and deck crew can easily assess conditions port and starboard, check the waves at a specific working area such as a gangway or ROV launch point, and spot differences between measurement areas before they affect the operation, turning a weather-critical operation into a controlled one.
Marius Five Aarset, CEO at Miros, added: “The 3D vessel view automatically adapts to each vessel’s installed WaveSystem configuration, whether it carries two, three or more measurement sources. The data displayed reflects the equipment and accurate sea state measurement at its installation points on the vessel.”
“We are committed and proud to support our customers in better identifying and understanding relevant, local sea conditions in real-time rather than having to rely on out-of-the-moment forecasts or hindcast assumptions.”
The visualization shows measurement sources, areas, and values in relation to the vessel. It does not represent a reconstructed 3D sea surface.


Leave a Reply